shipitfaststupid

No name or maker matches “”. Press Enter to search descriptions too.

Catalog / Analytics

0312X posts

Scintero: analytics that track churn and plan mix over time

An analytics tool for Supabase users to track churn and plan mix over time.

Problem it solvesTeams need clearer subscription analytics and churn math that matches Stripe.

Matt (@not_matt200) built Scintero for Supabase users. He reports 0 users and $0 MRR, and says it now counts churn the way Stripe does.

How they grewX followers

Visit ↗ x.commrr$0so far5 days

matt

@not_matt200

day 5 of building in public: - 0 users - 87 followers on x (+24%) - $0 mrr My churn rate didn't match Stripe's. Spent a chunk of the day finding out why: Stripe divides by everyone who paid during the month, not just who you had at the start. Now Scintero counts it Stripe's way. Also shipped: - Scintero connects to your Supabase with a read-only login. It can't change a single row, and Postgres itself enforces that. - Compare today with yesterday, or any day you pick - Plan mix over time: which plans are growing, which are dying What's the first number you check every morning?

Users
0
MRR
$0
Followers
87
on x
Sep 30, 2026Read on x.com ↗

Also filed under Analytics

  1. 0327

    Grail: on-chain analytics for collectible swaps and vaults

    I built an on-chain analytics page for @GrailCo , real-world collectibles turned into tokens on Base and Robinhood Chain. Grail is one of the few crypto apps where regular users make money without size, and the team is backed by a top web3 VC. I wanted to see behind the screen. Now anyone can. Every swap, pack, redeem and vault since day one: · 16.8k traders, $24.5M volume · 47% in profit overall, 67% for people trading through the Grail app · $196k in pack sales, 21k collectibles redeemed · who vaulted their own collectibles and whether it paid · what each launch did to volume, and which tokens rise with it ozzyxbt.github.io/grail-analytic…

    @ozzyxbt · Analytics

  2. 0232

    A medieval metrics dashboard for SaaS subscriptions

    I needed a metrics dashboard for my SaaS, so I built a medieval village instead, every paying customer is a villager I run a small Norwegian SaaS with my co-founder (it helps parents of children with special needs navigate the welfare bureaucracy). We just got our first paying subscribers, and I wanted a dashboard on the office wall; customers, MRR, churn, trend. But boring admin charts felt wrong for numbers that actually mean this much to us. So instead: a cozy pixel-art village, seen from above. **How it works:** * Every active subscriber = one villager wandering around * New customer → a new villager moves in. Someone cancels → a villager sadly walks away * Milestone buildings unlock as we grow: a cottage at 50, a house at 100, a farm at 250, town hall at 500, and a castle at 1000 * Parchment cards around the edges show the real numbers: MRR, new this week/month, progress to next milestone, and a trend graph fed by a daily snapshot job Stack: PixiJS on React, Kenney's Tiny Town tileset (CC0), one admin-gated metrics endpoint aggregating from the database, polling every 60s. The page runs for hours on a wall screen at stable memory. Ocean fills the left edge of the screen and forest the right, at any resolution, so it reads as a little world instead of a floating game board. We're at 45 villagers today. The castle site is still just scaffolding. That's the point, I get to watch it get built. One villager was suddenly standing in the middle of the pond. We've decided this is morning bathing culture and refuse to fix it.

    u/speaklifeandaimup · Analytics

  3. 0230

    Taisly: analytics that tracks visitors from first visit to payment

    My side project finally reached ~$1k MRR after almost 3 years I started Taisly in 2023 as a small tool for myself. Last month it made $808 MRR (via Stripe) + $103 (via Yolfi) from 117 premium users 😅 It’s not one of these “$10k MRR in 30 days” stories. It took almost 3 years, many months without sales, and I still spend only around 2 hours per week on it. Almost 90% of customers come from Google, old SEO pages, and translations. I barely used paid ads Stripe showed me how much money I received, but not which traffic actually brought it. So I connected Taisly to Talivia, another analytics product I’m building, and now I can see the full path from the first visit to payment The numbers are still small, but it feels good to finally see a side project paying every month 💰 Next goal is to understand which channels really work and try to grow it to $2k MRR

    u/taislygroup · Analytics

  4. 0172

    GainFrame: analytics that grew to mrr

    Day 58 of building GainFrame to $3k MRR $2,507 MRR. I usually hit a milestone and immediately start thinking about the next one. Trying not to do that this time. $2,500 is a number I never dreamed of hitting when I started. Also at 4k rev for the month Going to enjoy it for a day.

    @mjrode · Analytics

  5. 0073

    Project Echo: product analytics for SaaS founders

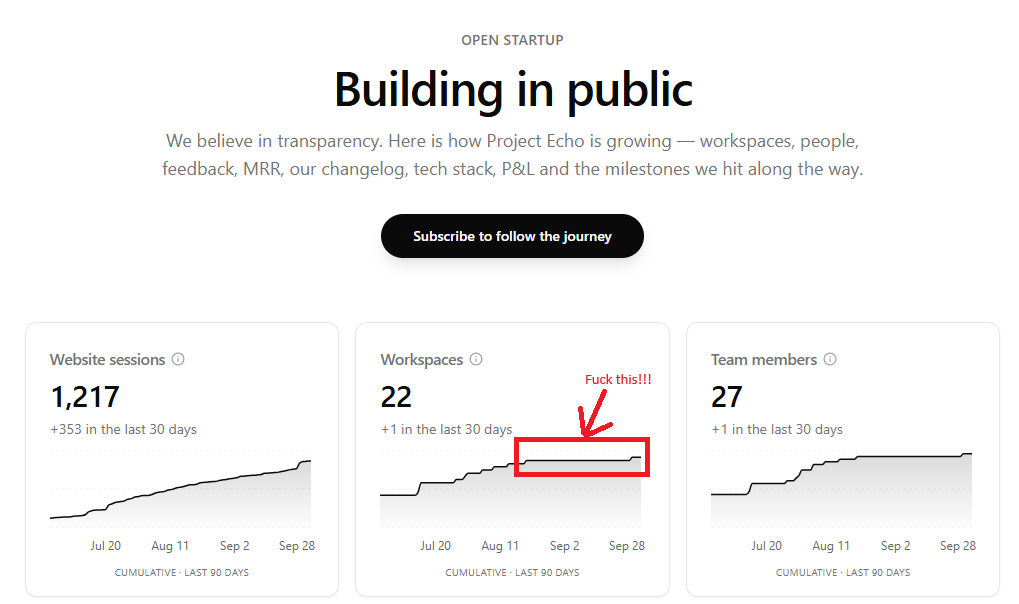
    I was lying in bed last night thinking about my SaaS, @projectecho_io and for the first time I was considering the option of shutting it down. Earlier in the evening I published my weekly post on my Substack, SaaS Decoded, a 4.5k word guide on how to set up product analytics as a SaaS founder. As I was lying in my rock hard Thai bed I couldn't help but think of all the hours I'd spent on Project Echo and what if instead of starting it, I put that effort into my Substack instead. It was a deeply depressing moment. I told myself at the start of the year that SaaS Decoded would be my main focus. When I decided to start Project Echo I went against this decision. Why? I think I believed I could handle another project. I wanted to build a SaaS that can scale and help me move closer to my goal of $20k MRR. I'm now starting to see that this is another trap I walked into. Without having a clear way to drive a significant number of eyeballs onto Project Echo, I was inevitably going to find myself in this position. I knew the marketing would be a challenge but never in my wildest dreams did I imagine that 4 months after starting the project I'd be in this position. The last legit signup to the service was on the 20th August, 39 days ago. Since that date there have been over 200 unique visitors to the website. I've posted about it more than a dozen times on social media. I've mentioned the app in multiple substack newsletters to my audience of 700+ email subscribers. I launched a free tool, MRR calculator which I shared on Hacker News and Reddit, as well as on my socials. I've managed to connect with 5 - 10 entrepreneurs over DMs and introduce them to Project Echo. Zero interest. What blows me away is I specifically picked a niche which is mature to help lower my risk. I thought by competing in a space that has at least a few players I would be able to tap into an existing market. I wouldn't have to wonder if there was demand for what I was building. If you're reading this and can relate, let me know your thoughts. I'm at a point where I really don't know what to do. Do I carry on pushing since it's been only 4 months and I don't yet have enough data to make any decision, or do I cut my loses and move on? What would you do? Link to Project Echo 👉 projectecho.io

    @justin_butlion · Analytics

  6. 0067

    A free calculator for planning MRR goals

    $10k MRR sounds easy. Then you do the math 😅 $30 a month = 334 customers. To get there in 12 months: 👀 11,667 visitors a month 📝 350 sign-ups a month 💳 35 new customers a month And 14 of them just replace the ones who churn 🩹 So I built a free calculator 🧮 What does your goal take? 👇

    @sv_novoselski · Analytics

  7. 0063

    MCP Connectors: connects tools to an ai analyst

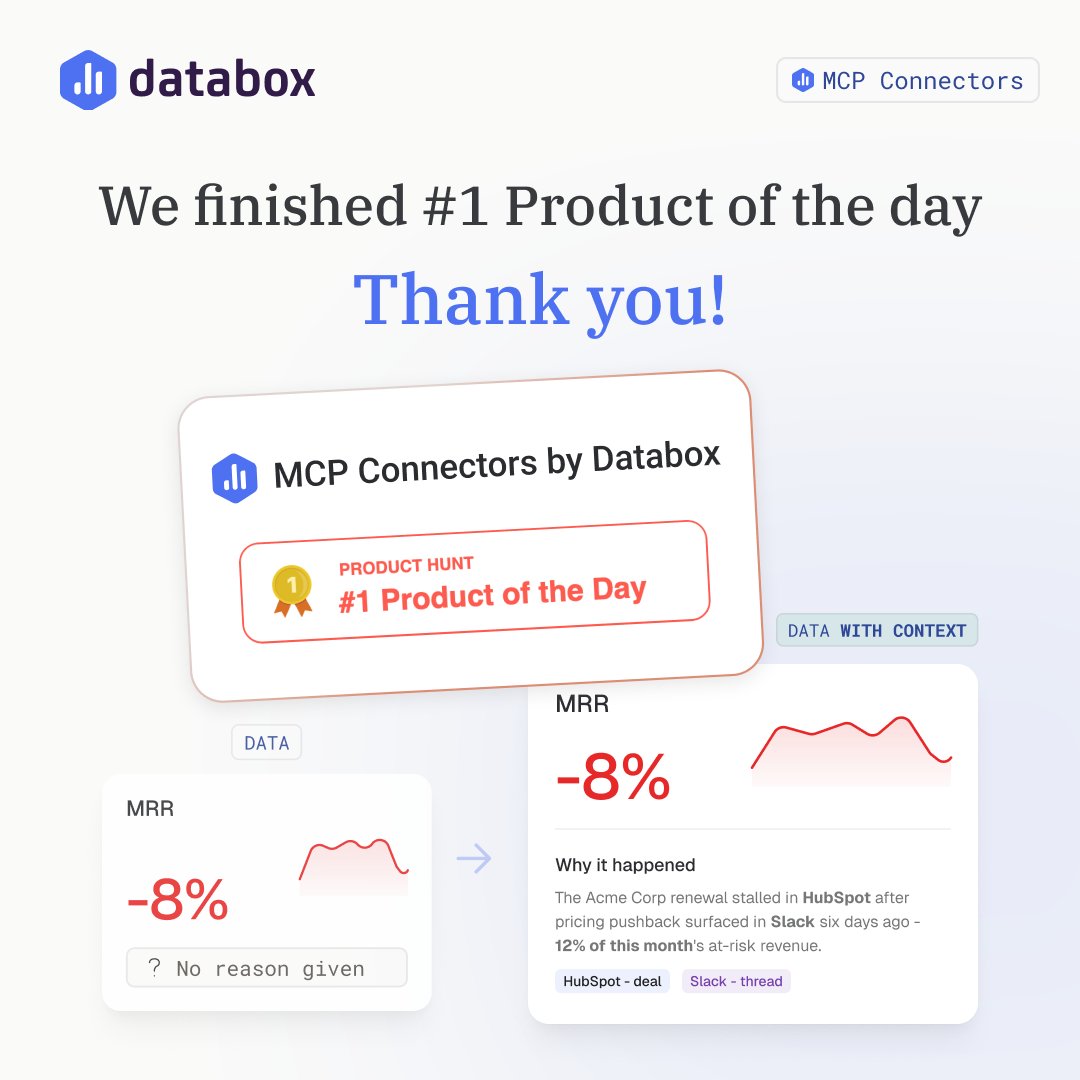
    We finished #1 Product of the Day on @ProductHunt 🏆 This year we launched on Product Hunt 4 times before this one: #3 Genie #3 Databox MCP #2 Skills Marketplace #2 Artifacts Yesterday, MCP Connectors took #1. Here's what it does and what we learned 👇 Your dashboard shows you that a number moved. It doesn't tell you why. The why lives somewhere else. A stalled deal in HubSpot. A pricing objection in a Slack thread. A bug in Linear that shipped on Tuesday. Finding it means opening three tools and piecing it together yourself. With MCP Connectors, you connect those tools to Genie, our AI Analyst. Ask "why did MRR drop 8%?" and you get the number and the reason, with links to the actual deal or thread behind it. Genie can also act on what it finds. 3 things the launch comments made clear: 1. Almost nobody finds the "why" in their dashboard. It's always in the CRM, Slack, support desk, or a doc somewhere. 2. People want more than answers. They want AI to take action, like pausing an ad campaign that's burning budget. 2. Trust matters most. The best questions were about where an answer came from and which tool you'd let AI touch first. Thank you to the @databoxHQ team for shipping this, and to everyone who upvoted, commented, and tried it. So, which tool would you connect first?

    @zigapoto · Analytics

  8. 0046

    USGS LiDAR app: explores lidar and aerial imagery on a map

    The USGS LiDAR app just crossed 37,000 users in less than 1 month! Main takeaway: people love exploring the data, but it needs to be faster. The current version pulls from USGS as you move around the map. That keeps it cheap and gives national coverage, but speed depends on live requests + processing. So I built a new version that preprocesses LiDAR + aerial imagery into multi-resolution tiles. As you zoom in, it only loads the detail you need. The result is lightning fast... smooth flying, instant LiDAR/imagery comparison, and real-time elevation rescaling. The problem is storage. Massachusetts: ~100 GB, Colorado: ~1 TB, Entire US: 60+ terabytes. At full scale, hosting would cost $6k-12K/year. Also learned that 68% of users are on mobile, so a better mobile version is coming. Hope to have a faster version soon when I figure out how to pay for it! Happy exploring on the original app: mattmullin.space/state-lidar

    @matthewwmullin · Analytics