Web and product analytics, AI-search visibility, dashboards and the numbers makers watch every morning.
9 Analytics products · page 1 of 1
mjrode
@mjrode
Day 58 of building GainFrame to $3k MRR
$2,507 MRR.
I usually hit a milestone and immediately start thinking about the next one.
Trying not to do that this time.
$2,500 is a number I never dreamed of hitting when I started. Also at 4k rev for the month
Going to enjoy it for a day.
An analytics product for makers tracking revenue growth.
ProblemFounders need a clearer view of revenue progress.
So far
58 days
Justin Butlion
@justin_butlion
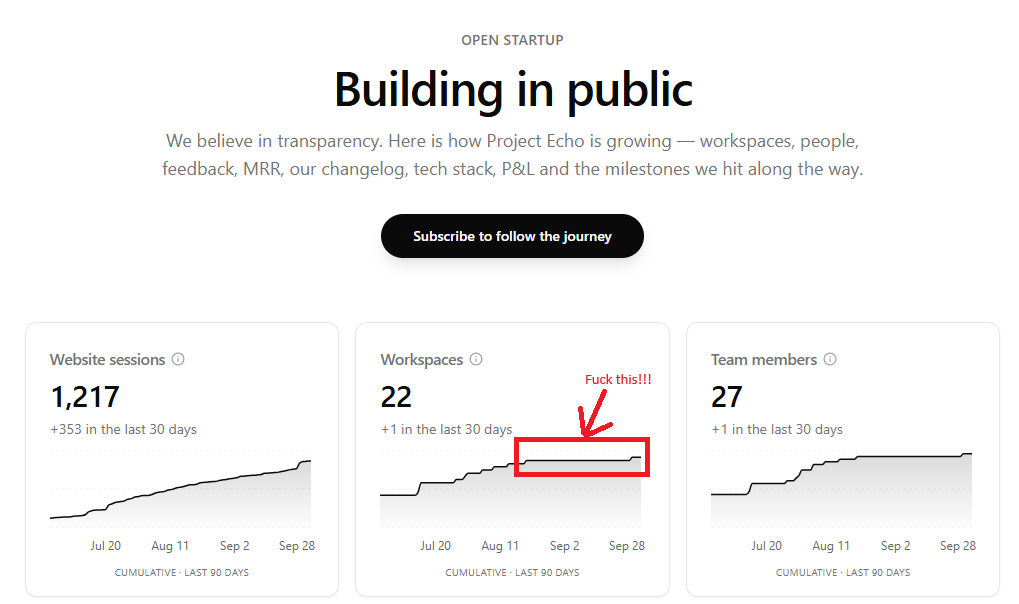
I was lying in bed last night thinking about my SaaS, @projectecho_io and for the first time I was considering the option of shutting it down.
Earlier in the evening I published my weekly post on my Substack, SaaS Decoded, a 4.5k word guide on how to set up product analytics as a SaaS founder.
As I was lying in my rock hard Thai bed I couldn't help but think of all the hours I'd spent on Project Echo and what if instead of starting it, I put that effort into my Substack instead.
It was a deeply depressing moment.
I told myself at the start of the year that SaaS Decoded would be my main focus.
When I decided to start Project Echo I went against this decision. Why?
I think I believed I could handle another project. I wanted to build a SaaS that can scale and help me move closer to my goal of $20k MRR.
I'm now starting to see that this is another trap I walked into.
Without having a clear way to drive a significant number of eyeballs onto Project Echo, I was inevitably going to find myself in this position.
I knew the marketing would be a challenge but never in my wildest dreams did I imagine that 4 months after starting the project I'd be in this position.
The last legit signup to the service was on the 20th August, 39 days ago.
Since that date there have been over 200 unique visitors to the website. I've posted about it more than a dozen times on social media. I've mentioned the app in multiple substack newsletters to my audience of 700+ email subscribers.
I launched a free tool, MRR calculator which I shared on Hacker News and Reddit, as well as on my socials.
I've managed to connect with 5 - 10 entrepreneurs over DMs and introduce them to Project Echo. Zero interest.
What blows me away is I specifically picked a niche which is mature to help lower my risk.
I thought by competing in a space that has at least a few players I would be able to tap into an existing market. I wouldn't have to wonder if there was demand for what I was building.
If you're reading this and can relate, let me know your thoughts. I'm at a point where I really don't know what to do.
Do I carry on pushing since it's been only 4 months and I don't yet have enough data to make any decision, or do I cut my loses and move on?
What would you do?
Link to Project Echo 👉 projectecho.io
Sign-ups
1
last legit
Unique visitors
200
since 20th August
Email subscribers
700+
Substack audience
How they grewSocial posts, Substack newsletters, Hacker News, Reddit, and DMs
A product analytics tool for SaaS founders who want clearer usage data.
ProblemSaaS founders struggle to set up and understand product analytics.
So far
4 months
Svetloslav Novoselski
@sv_novoselski
$10k MRR sounds easy.
Then you do the math 😅
$30 a month = 334 customers.
To get there in 12 months:
👀 11,667 visitors a month
📝 350 sign-ups a month
💳 35 new customers a month
And 14 of them just replace the ones who churn 🩹
So I built a free calculator 🧮
What does your goal take? 👇
ProblemMRR goals can look simple until the customer math gets real.
MRR
$10K
Ziga Potocnik
@zigapoto
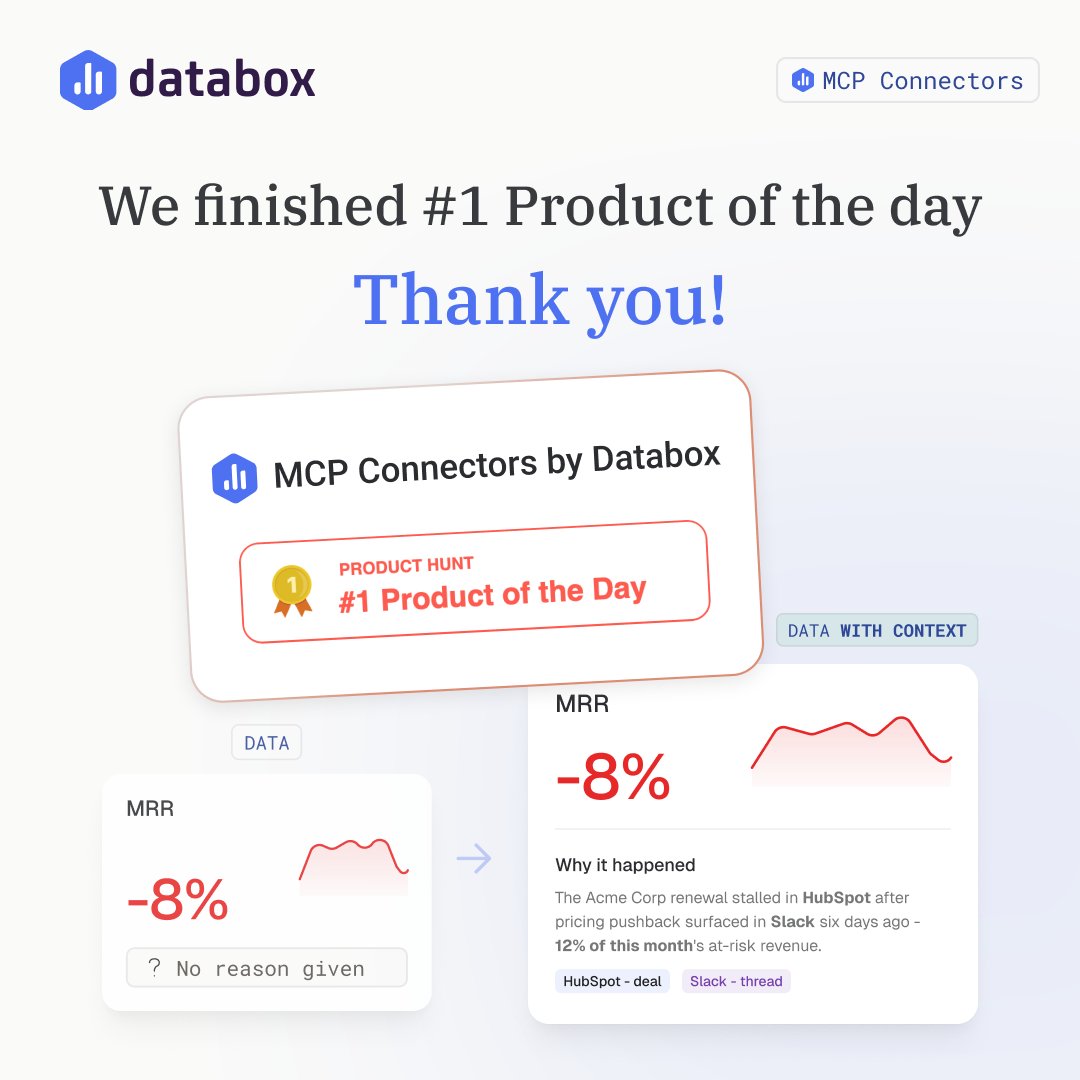
We finished #1 Product of the Day on @ProductHunt 🏆
This year we launched on Product Hunt 4 times before this one:
#3 Genie
#3 Databox MCP
#2 Skills Marketplace
#2 Artifacts
Yesterday, MCP Connectors took #1.
Here's what it does and what we learned 👇
Your dashboard shows you that a number moved. It doesn't tell you why.
The why lives somewhere else. A stalled deal in HubSpot. A pricing objection in a Slack thread. A bug in Linear that shipped on Tuesday. Finding it means opening three tools and piecing it together yourself.
With MCP Connectors, you connect those tools to Genie, our AI Analyst.
Ask "why did MRR drop 8%?" and you get the number and the reason, with links to the actual deal or thread behind it. Genie can also act on what it finds.
3 things the launch comments made clear:
1. Almost nobody finds the "why" in their dashboard. It's always in the CRM, Slack, support desk, or a doc somewhere.
2. People want more than answers. They want AI to take action, like pausing an ad campaign that's burning budget.
2. Trust matters most. The best questions were about where an answer came from and which tool you'd let AI touch first.
Thank you to the @databoxHQ team for shipping this, and to everyone who upvoted, commented, and tried it.
So, which tool would you connect first?
An integration layer that connects business tools to Genie, their AI analyst.
ProblemDashboard numbers change without explaining why.
Matt Mullin
@matthewwmullin
The USGS LiDAR app just crossed 37,000 users in less than 1 month!
Main takeaway: people love exploring the data, but it needs to be faster.
The current version pulls from USGS as you move around the map. That keeps it cheap and gives national coverage, but speed depends on live requests + processing.
So I built a new version that preprocesses LiDAR + aerial imagery into multi-resolution tiles. As you zoom in, it only loads the detail you need.
The result is lightning fast... smooth flying, instant LiDAR/imagery comparison, and real-time elevation rescaling.
The problem is storage. Massachusetts: ~100 GB, Colorado: ~1 TB, Entire US: 60+ terabytes.
At full scale, hosting would cost $6k-12K/year.
Also learned that 68% of users are on mobile, so a better mobile version is coming.
Hope to have a faster version soon when I figure out how to pay for it!
Happy exploring on the original app:
mattmullin.space/state-lidar
An app for exploring lidar and aerial imagery on a map.
ProblemMap-based lidar browsing is slow when data loads live as you pan and zoom.
So far
less than 1 month
Joshua Pi'Rwot
@pirwot
Someone quoted a number at me in a group chat three weeks ago. The median profitable micro-SaaS earns about 4,200 dollars a month, so roughly fifty thousand a year. He was using it to argue that going solo was more viable than people think.
I went looking for where it came from. Mostly curiosity.
I found a second published median for what looks like the same population in the same year: five hundred dollars a month. And a third at around two thousand. Three medians, one sector, an eightfold spread, and no one anywhere reconciling them.
That is when the interesting question stopped being how much solo founders earn.
𝘌𝘷𝘦𝘳𝘺 𝘯𝘶𝘮𝘣𝘦𝘳 𝘺𝘰𝘶 𝘩𝘢𝘷𝘦 𝘳𝘦𝘢𝘥 𝘢𝘣𝘰𝘶𝘵 𝘸𝘩𝘢𝘵 𝘴𝘰𝘭𝘰 𝘧𝘰𝘶𝘯𝘥𝘦𝘳𝘴 𝘦𝘢𝘳𝘯 𝘸𝘢𝘴 𝘤𝘰𝘮𝘱𝘶𝘵𝘦𝘥 𝘰𝘷𝘦𝘳 𝘵𝘩𝘦 𝘰𝘯𝘦𝘴 𝘸𝘩𝘰 𝘴𝘶𝘳𝘷𝘪𝘷𝘦𝘥 𝘭𝘰𝘯𝘨 𝘦𝘯𝘰𝘶𝘨𝘩 𝘵𝘰 𝘣𝘦 𝘤𝘰𝘶𝘯𝘵𝘦𝘥.
𝗧𝗵𝗿𝗲𝗲 𝗠𝗲𝗱𝗶𝗮𝗻𝘀, 𝗢𝗻𝗲 𝗣𝗼𝗽𝘂𝗹𝗮𝘁𝗶𝗼𝗻
Here are the numbers in circulation, with what each is actually measuring, as far as I could establish.
𝘼𝙗𝙤𝙪𝙩 4,200 𝙙𝙤𝙡𝙡𝙖𝙧𝙨 𝙖 𝙢𝙤𝙣𝙩𝙝
Widely quoted in 2026. Note the qualifier that travels with it and then gets dropped: median profitable micro-SaaS. Profitable. It is a median of the survivors, and the word doing the work is usually lost by the second retelling.
𝘼𝙗𝙤𝙪𝙩 500 𝙙𝙤𝙡𝙡𝙖𝙧𝙨 𝙖 𝙢𝙤𝙣𝙩𝙝
From an analysis of a thousand-plus products, published 2025. This one counts listed products rather than profitable ones, which is a wider and less flattering net.
𝘼𝙗𝙤𝙪𝙩 24,000 𝙙𝙤𝙡𝙡𝙖𝙧𝙨 𝙖 𝙮𝙚𝙖𝙧, 𝙨𝙤 𝙧𝙤𝙪𝙜𝙝𝙡𝙮 2,000 𝙖 𝙢𝙤𝙣𝙩𝙝
A third figure, sitting neatly between the other two, from survey-adjacent reporting.
Each one is honestly reported. None of them is wrong. They are answers to three different questions that are all being asked in the same words. And the further any of them travels from its source, the more confident it gets, because the qualifiers fall off first.
𝘈 𝘮𝘦𝘥𝘪𝘢𝘯 𝘪𝘴 𝘮𝘦𝘢𝘯𝘪𝘯𝘨𝘭𝘦𝘴𝘴 𝘸𝘪𝘵𝘩𝘰𝘶𝘵 𝘪𝘵𝘴 𝘥𝘦𝘯𝘰𝘮𝘪𝘯𝘢𝘵𝘰𝘳, 𝘢𝘯𝘥 𝘪𝘯 𝘵𝘩𝘪𝘴 𝘴𝘦𝘤𝘵𝘰𝘳 𝘵𝘩𝘦 𝘥𝘦𝘯𝘰𝘮𝘪𝘯𝘢𝘵𝘰𝘳 𝘪𝘴 𝘢𝘭𝘮𝘰𝘴𝘵 𝘯𝘦𝘷𝘦𝘳 𝘴𝘵𝘢𝘵𝘦𝘥.
𝗧𝗵𝗲 𝗗𝗲𝗻𝗼𝗺𝗶𝗻𝗮𝘁𝗼𝗿 𝗜𝘀 𝗧𝗵𝗲 𝗪𝗵𝗼𝗹𝗲 𝗦𝘁𝗼𝗿𝘆
Ask who got counted. Everything turns on that.
If you measure the products that are currently listed on a public directory, you have excluded everything that was taken down, which correlates almost perfectly with everything that failed. If you measure profitable products, you have excluded the unprofitable ones by definition. If you survey the members of a community built around a paid conference, you have selected for people serious and solvent enough to attend one.
Every one of those is a reasonable sampling frame for some question. Each of them sidesteps the question the reader is actually asking, which is: if I start one of these, what happens to me?
That question needs the population of everyone who started. It goes unmeasured for a structural reason rather than a lazy one. An abandoned side project just stops. Updates end, the domain lapses, the directory listing comes down, and the data point quietly ceases to have ever existed.
𝙒𝙝𝙮 𝙩𝙝𝙚 𝙗𝙞𝙖𝙨 𝙧𝙪𝙣𝙨 𝙤𝙣𝙚 𝙬𝙖𝙮
Failure removes itself from the dataset. Quietly. Success stays in it and gets louder, because a working business has a reason to keep its listing current, publish its revenue, and go on a podcast.
So the measured population drifts upward over time without a single number being falsified. The sector is showing you a filtered photograph and calling it a census. Nobody had to lie for that to happen.
𝗪𝗮𝘁𝗰𝗵 𝗧𝗵𝗲 𝗠𝗲𝗱𝗶𝗮𝗻 𝗠𝗼𝘃𝗲
It helps to see the mechanism rather than just be told about it, so here is the arithmetic in miniature.
Imagine a hundred people launch a product in the same month. A year later the picture is what every source agrees on. Fifty sit at zero or near it. Thirty are under a thousand a month. Fifteen land between one and ten thousand. Five clear that.
The median of all hundred is somewhere near zero. That is the number a founder deciding whether to start should want.
Now wait two more years and measure again. The fifty at zero have mostly stopped. Their domains lapse and their listings come down. They leave the dataset rather than registering as failures, because the dataset is built by looking at what exists.
Measure the survivors and the median is now somewhere in the low thousands. Every business in the picture stayed exactly where it was. The bottom of the distribution walked out of the room and took the median with it.
𝘛𝘩𝘦 𝘮𝘦𝘥𝘪𝘢𝘯 𝘳𝘰𝘴𝘦 𝘣𝘦𝘤𝘢𝘶𝘴𝘦 𝘵𝘩𝘦 𝘱𝘦𝘰𝘱𝘭𝘦 𝘪𝘵 𝘸𝘢𝘴 𝘮𝘦𝘢𝘴𝘶𝘳𝘪𝘯𝘨 𝘭𝘦𝘧𝘵. 𝘛𝘩𝘢𝘵 𝘪𝘴 𝘵𝘩𝘦 𝘦𝘯𝘵𝘪𝘳𝘦 𝘵𝘳𝘪𝘤𝘬, 𝘢𝘯𝘥 𝘪𝘵 𝘩𝘢𝘱𝘱𝘦𝘯𝘴 𝘸𝘪𝘵𝘩𝘰𝘶𝘵 𝘢𝘯𝘺𝘰𝘯𝘦 𝘪𝘯𝘵𝘦𝘯𝘥𝘪𝘯𝘨 𝘪𝘵.
Then add the second filter, the word profitable, and the remaining population is smaller and higher again. Two filters, both defensible, and the published figure is now several times the one a prospective founder actually needs.
𝗪𝗵𝗼 𝗕𝗲𝗻𝗲𝗳𝗶𝘁𝘀 𝗙𝗿𝗼𝗺 𝗧𝗵𝗲 𝗢𝗽𝘁𝗶𝗺𝗶𝘀𝘁𝗶𝗰 𝗡𝘂𝗺𝗯𝗲𝗿
Ask who is producing these figures, because in this sector almost nobody is doing it for free.
Look at who publishes them. People selling micro-SaaS courses. Boilerplate starter kits. Directories that charge for listings, communities that charge for membership, and tool vendors whose customers are aspiring solo founders. An encouraging median is commercially useful to all of them. A pessimistic one costs them customers.
Be careful with that, because it is a claim about incentives rather than about anyone's honesty, and the two get confused. Fabrication has little to do with it. When three figures are available and one of them is cheerful, the cheerful one travels. Hundreds of people pick it independently. Every one of them is acting in good faith.
That is how a sector ends up with a consensus number that arrived by drift, with no author and no source.
𝙏𝙝𝙚 𝙩𝙚𝙡𝙡 𝙩𝙤 𝙬𝙖𝙩𝙘𝙝 𝙛𝙤𝙧
When you see one of these figures, look for whether the qualifier survived. "Median profitable micro-SaaS" is a defensible statement. "Median micro-SaaS" is a different and much lower number. If the piece you are reading has dropped the word, the author either did not notice or did not want you to.
𝗧𝗵𝗲 𝗢𝗻𝗲 𝗥𝗲𝗮𝗹 𝗦𝘂𝗿𝘃𝗲𝘆 𝗦𝗮𝘆𝘀 𝗦𝗼𝗺𝗲𝘁𝗵𝗶𝗻𝗴 𝗜𝗻𝗰𝗼𝗻𝘃𝗲𝗻𝗶𝗲𝗻𝘁
There is a genuine benchmark in this space, and it deserves to be treated differently from the blog numbers.
MicroConf's State of Independent SaaS ran its fourth annual edition in 2024, covering founders across 41 countries and 265 cities. It has a defined population and repeat waves, which is two more methodological virtues than anything else I found.
I will be honest about one thing here, because it is the same disease. I wanted to give you the sample size and I cannot. One secondary source says 836 founders, another says nearly 700, and the report itself sits behind a download form I would have to fill in to check. So I am quoting the country count, which comes from MicroConf directly, and leaving the n out rather than picking the number I liked.
Two things about it.
First, it is two years old. The most recent edition I could locate is from 2024. In a sector where people confidently quote 2026 medians, the best real survey predates the AI tooling wave that changed what one person can build. That gap is a reason for more caution.
Second, and more interesting: it found that three-founder teams grew two to three times faster than solo founders.
𝘛𝘩𝘦 𝘰𝘯𝘭𝘺 𝘳𝘪𝘨𝘰𝘳𝘰𝘶𝘴 𝘴𝘶𝘳𝘷𝘦𝘺 𝘪𝘯 𝘵𝘩𝘦 𝘨𝘦𝘯𝘳𝘦 𝘱𝘰𝘪𝘯𝘵𝘴 𝘢𝘨𝘢𝘪𝘯𝘴𝘵 𝘵𝘩𝘦 𝘵𝘩𝘪𝘯𝘨 𝘵𝘩𝘦 𝘨𝘦𝘯𝘳𝘦 𝘦𝘹𝘪𝘴𝘵𝘴 𝘵𝘰 𝘤𝘦𝘭𝘦𝘣𝘳𝘢𝘵𝘦.
That finding rarely gets quoted. The reason is mundane: a survey result saying "you would probably do better with co-founders" fits badly into content aimed at people who have already decided to go it alone.
𝗧𝗵𝗿𝗲𝗲 𝗖𝗹𝗮𝗶𝗺𝘀 𝗧𝗵𝗮𝘁 𝗙𝗮𝗹𝗹 𝗔𝗽𝗮𝗿𝘁 𝗢𝗻 𝗦𝗶𝗴𝗵𝘁
Some of these claims fail on their face. Look at the shape rather than the number.
"28 𝙥𝙚𝙧𝙘𝙚𝙣𝙩 𝙤𝙛 𝙛𝙤𝙪𝙣𝙙𝙚𝙧𝙨 𝙦𝙪𝙞𝙩 𝙗𝙚𝙩𝙬𝙚𝙚𝙣 1,000 𝙖𝙣𝙙 5,000 𝙙𝙤𝙡𝙡𝙖𝙧𝙨 𝙖 𝙢𝙤𝙣𝙩𝙝"
Over what period? A churn figure without an observation window is not a statistic. It is a number. Twenty-eight percent over one year and twenty-eight percent over ten years describe completely different worlds, and the claim as published stays silent on which.
"54 𝙥𝙚𝙧𝙘𝙚𝙣𝙩 𝙤𝙛 𝙥𝙧𝙤𝙙𝙪𝙘𝙩𝙨 𝙢𝙖𝙠𝙚 𝙣𝙤𝙩𝙝𝙞𝙣𝙜"
Published alongside a distribution from the same source that puts about fifty percent in the bottom band. Those two figures contradict each other, and the contradiction went unremarked, which tells you how carefully these get assembled.
"21 𝙥𝙚𝙧𝙘𝙚𝙣𝙩 𝙤𝙛 𝙘𝙤𝙢𝙢𝙞𝙩𝙩𝙚𝙙, 𝘼𝙄-𝙡𝙚𝙫𝙚𝙧𝙖𝙜𝙚𝙙 𝙛𝙤𝙪𝙣𝙙𝙚𝙧𝙨 𝙝𝙞𝙩 500,000 𝙙𝙤𝙡𝙡𝙖𝙧𝙨, 𝙖𝙜𝙖𝙞𝙣𝙨𝙩 𝙖 𝙣𝙖𝙩𝙞𝙤𝙣𝙖𝙡 𝙖𝙫𝙚𝙧𝙖𝙜𝙚 𝙤𝙛 1.4 𝙥𝙚𝙧𝙘𝙚𝙣𝙩"
This is the most instructive one, because the error is visible in the sentence. The sample is defined partly by the outcome: committed founders who used AI well. Then the comparison to a general average is presented as though commitment caused the difference. The source itself concedes survivorship bias and publishes the comparison anyway.
𝗧𝗵𝗲 𝗦𝗵𝗮𝗽𝗲 𝗜𝘀 𝗧𝗵𝗲 𝗣𝗮𝗿𝘁 𝗪𝗼𝗿𝘁𝗵 𝗧𝗿𝘂𝘀𝘁𝗶𝗻𝗴
Here is what I think survives.
The shape is consistent across every source, and the shape is a long tail with almost everything piled at the bottom. Roughly half of products earn approximately nothing. Something like one in ten reaches a level that would replace a professional salary. A very small percentage, low single digits, reaches the numbers that get written about.
That shape is believable. It matches every other creative-and-distribution market anyone has measured properly. Apps, books, music, newsletters, restaurants. The mechanism is the same in all of them, which is why I trust the shape while holding every specific median loosely.
Where you personally sit in that distribution is beyond what this data can say, and beyond what anyone quoting it can say either, which is the actual practical point of this article.
𝗙𝗼𝘂𝗿 𝗡𝘂𝗺𝗯𝗲𝗿𝘀 𝗬𝗼𝘂 𝗖𝗮𝗻 𝗔𝗰𝘁𝘂𝗮𝗹𝗹𝘆 𝗞𝗻𝗼𝘄
Since the sector's benchmarks are useless for judging your own position, build internal ones. Four that are cheap and mean something.
1. 𝙈𝙤𝙣𝙩𝙝𝙨 𝙤𝙛 𝙧𝙪𝙣𝙬𝙖𝙮, 𝙨𝙩𝙖𝙩𝙚𝙙 𝙖𝙨 𝙖 𝙙𝙖𝙩𝙚
The actual calendar date on which you must have income or stop. Written down, in figures, where you can see it. People avoid this number. It is the one that decides which choices you still have.
2. 𝙋𝙖𝙮𝙞𝙣𝙜 𝙘𝙪𝙨𝙩𝙤𝙢𝙚𝙧𝙨, 𝙘𝙤𝙪𝙣𝙩𝙚𝙙 𝙗𝙮 𝙝𝙖𝙣𝙙
Paying customers only. Signups, trials and your own test accounts stay out of the count. Use the number you could read out from memory. Below about twenty, dashboards are actively misleading because the percentages swing wildly on single events.
3. 𝙒𝙝𝙚𝙩𝙝𝙚𝙧 𝙡𝙖𝙨𝙩 𝙢𝙤𝙣𝙩𝙝'𝙨 𝙘𝙪𝙨𝙩𝙤𝙢𝙚𝙧𝙨 𝙖𝙧𝙚 𝙨𝙩𝙞𝙡𝙡 𝙝𝙚𝙧𝙚
Retention on a small base is the most informative number a small business has and the one most often skipped in favor of growth. Five hundred users who stay beats five thousand who pass through, and it is a far better predictor of whether the thing works.
4. 𝙔𝙤𝙪𝙧 𝙤𝙬𝙣 𝙝𝙤𝙪𝙧𝙡𝙮 𝙧𝙖𝙩𝙚, 𝙘𝙖𝙡𝙘𝙪𝙡𝙖𝙩𝙚𝙙 𝙝𝙤𝙣𝙚𝙨𝙩𝙡𝙮
Total money earned, divided by total hours worked on it, since the beginning. Include the nights. All of them. It is a brutal number early on. It should be. This is the comparison that makes "I should get a job" true or false, and most people settle that question on feeling.
𝘍𝘰𝘶𝘳 𝘯𝘶𝘮𝘣𝘦𝘳𝘴 𝘺𝘰𝘶 𝘤𝘢𝘯 𝘤𝘩𝘦𝘤𝘬 𝘰𝘯 𝘢 𝘚𝘶𝘯𝘥𝘢𝘺 𝘢𝘧𝘵𝘦𝘳𝘯𝘰𝘰𝘯 𝘸𝘪𝘭𝘭 𝘵𝘦𝘭𝘭 𝘺𝘰𝘶 𝘮𝘰𝘳𝘦 𝘢𝘣𝘰𝘶𝘵 𝘺𝘰𝘶𝘳 𝘣𝘶𝘴𝘪𝘯𝘦𝘴𝘴 𝘵𝘩𝘢𝘯 𝘦𝘷𝘦𝘳𝘺 𝘣𝘦𝘯𝘤𝘩𝘮𝘢𝘳𝘬 𝘱𝘶𝘣𝘭𝘪𝘴𝘩𝘦𝘥 𝘵𝘩𝘪𝘴 𝘺𝘦𝘢𝘳.
One condition attached, and it is the one people skip. Computed once, those four numbers are trivia. Their value is in the delta. What your runway date was in June against what it is now. Whether retention held while you were shipping. Whether the hourly rate is climbing or flat. A number you check once tells you where you are. The same number checked monthly tells you which direction you are moving, and direction is what carries information about next quarter.
So whatever you use, use something that keeps the history. A spreadsheet works. Recalculating from scratch each time you feel anxious is what most people do, and it costs you the one comparison that would have helped.
𝗪𝗵𝗮𝘁 𝗧𝗵𝗶𝘀 𝗟𝗼𝗼𝗸𝘀 𝗟𝗶𝗸𝗲 𝗙𝗿𝗼𝗺 𝗞𝗮𝗺𝗽𝗮𝗹𝗮
There is a version of this that is specific to where I sit, and it cuts in an unexpected direction.
Every figure above is denominated in dollars and implicitly priced against a Western cost of living. Fifty thousand dollars a year is a modest outcome in San Francisco and a different proposition entirely in Kampala, Nairobi or Lagos. The same revenue, against a different cost base, is a different life.
So the optimistic-sounding numbers are, if anything, understated for a founder here, on the income side.
The distribution is harsher on the other side, though, and this is the part that gets left out. Distribution is the binding constraint in solo software. It is also where sitting outside the main market costs you most. Payment rails take longer to set up. Your home market is too small to be your first market. The audience game runs on platforms whose defaults were built for somewhere else.
𝘛𝘩𝘦 𝘳𝘦𝘷𝘦𝘯𝘶𝘦 𝘵𝘩𝘢𝘵 𝘤𝘰𝘶𝘯𝘵𝘴 𝘢𝘴 𝘴𝘶𝘤𝘤𝘦𝘴𝘴 𝘩𝘦𝘳𝘦 𝘪𝘴 𝘭𝘰𝘸𝘦𝘳. 𝘛𝘩𝘦 𝘱𝘳𝘰𝘣𝘢𝘣𝘪𝘭𝘪𝘵𝘺 𝘰𝘧 𝘳𝘦𝘢𝘤𝘩𝘪𝘯𝘨 𝘪𝘵 𝘪𝘴 𝘢𝘭𝘴𝘰 𝘭𝘰𝘸𝘦𝘳. 𝘉𝘰𝘵𝘩 𝘢𝘥𝘫𝘶𝘴𝘵𝘮𝘦𝘯𝘵𝘴 𝘨𝘰 𝘶𝘯𝘱𝘶𝘣𝘭𝘪𝘴𝘩𝘦𝘥, 𝘴𝘰 𝘱𝘦𝘰𝘱𝘭𝘦 𝘪𝘮𝘱𝘰𝘳𝘵 𝘵𝘩𝘦 𝘸𝘩𝘰𝘭𝘦 𝘱𝘪𝘤𝘵𝘶𝘳𝘦 𝘳𝘢𝘸.
So the local founder gets both readings at their worst. Encouraged by a median computed over survivors in a richer market. Then judged against a growth rate that assumes access they were never given. If you are building from here, the four internal numbers at the end of this piece are the only instruments calibrated to your actual situation.
𝗬𝗲𝘀, 𝗜 𝗛𝗮𝘃𝗲 𝗦𝗽𝗲𝗻𝘁 𝗔𝗻 𝗔𝗿𝘁𝗶𝗰𝗹𝗲 𝗦𝗮𝘆𝗶𝗻𝗴 𝗜 𝗗𝗼 𝗡𝗼𝘁 𝗞𝗻𝗼𝘄
"𝙔𝙤𝙪 𝙝𝙖𝙫𝙚 𝙟𝙪𝙨𝙩 𝙨𝙥𝙚𝙣𝙩 𝙖𝙣 𝙖𝙧𝙩𝙞𝙘𝙡𝙚 𝙨𝙖𝙮𝙞𝙣𝙜 𝙮𝙤𝙪 𝙙𝙤 𝙣𝙤𝙩 𝙠𝙣𝙤𝙬"
Fairly put. What I know is narrower than what the sector claims. It is still usable. The distribution is long-tailed. The published medians disagree by a factor of eight. The best survey is stale and says something the genre would rather skip. And your own numbers beat all of it.
I would rather hand you that than a confident figure I would have to abandon the moment you pushed.
"𝙏𝙝𝙞𝙨 𝙖𝙥𝙥𝙡𝙞𝙚𝙨 𝙩𝙤 𝙚𝙫𝙚𝙧𝙮 𝙞𝙣𝙙𝙪𝙨𝙩𝙧𝙮, 𝙨𝙤 𝙞𝙩 𝙞𝙨 𝙣𝙤𝙩 𝙧𝙚𝙖𝙡𝙡𝙮 𝙖𝙗𝙤𝙪𝙩 𝙞𝙣𝙙𝙞𝙚 𝙝𝙖𝙘𝙠𝙚𝙧𝙨"
Selection bias is general, true. But it bites hardest where exit is silent and entry is free, and solo software is close to the purest example of both. Starting is free and silent. Quitting is free and silent. That combination is what makes the measurement problem unusually severe here rather than merely present.
"𝙏𝙝𝙚 𝘼𝙄 𝙩𝙤𝙤𝙡𝙞𝙣𝙜 𝙬𝙖𝙫𝙚 𝙘𝙝𝙖𝙣𝙜𝙚𝙙 𝙖𝙡𝙡 𝙤𝙛 𝙩𝙝𝙞𝙨 𝙖𝙣𝙮𝙬𝙖𝙮"
Possibly, and this is the strongest objection. If one person can now build what took four, the historical distribution may genuinely be a poor guide. Two things though. The build was rarely the binding constraint, distribution was, and the tooling wave leaves distribution roughly where it found it. And the best survey predates the wave, so anyone claiming to know what it did to the numbers is reasoning from anecdote. Including me.
𝗬𝗼𝘂 𝗛𝗮𝘃𝗲 𝗕𝗲𝗲𝗻 𝗨𝘀𝗶𝗻𝗴 𝗦𝗼𝗺𝗲𝗼𝗻𝗲 𝗘𝗹𝘀𝗲'𝘀 𝗜𝗻𝘀𝘁𝗿𝘂𝗺𝗲𝗻𝘁𝘀
There is a version of this article that reads as discouragement. The argument runs the other way.
You have been navigating with someone else's instruments, calibrated for a population you are not in. Almost every number you have absorbed about what this life pays was computed over the people it worked for.
𝘠𝘰𝘶 𝘢𝘳𝘦 𝘯𝘰𝘵 𝘣𝘦𝘩𝘪𝘯𝘥 𝘵𝘩𝘦 𝘮𝘦𝘥𝘪𝘢𝘯. 𝘛𝘩𝘦𝘳𝘦 𝘪𝘴 𝘯𝘰 𝘮𝘦𝘥𝘪𝘢𝘯. 𝘛𝘩𝘦𝘳𝘦 𝘪𝘴 𝘺𝘰𝘶𝘳 𝘳𝘶𝘯𝘸𝘢𝘺 𝘥𝘢𝘵𝘦, 𝘺𝘰𝘶𝘳 𝘤𝘶𝘴𝘵𝘰𝘮𝘦𝘳 𝘤𝘰𝘶𝘯𝘵, 𝘺𝘰𝘶𝘳 𝘳𝘦𝘵𝘦𝘯𝘵𝘪𝘰𝘯, 𝘢𝘯𝘥 𝘺𝘰𝘶𝘳 𝘳𝘦𝘢𝘭 𝘩𝘰𝘶𝘳𝘭𝘺 𝘳𝘢𝘵𝘦, 𝘢𝘯𝘥 𝘵𝘩𝘰𝘴𝘦 𝘧𝘰𝘶𝘳 𝘺𝘰𝘶 𝘤𝘢𝘯 𝘢𝘤𝘵𝘶𝘢𝘭𝘭𝘺 𝘬𝘯𝘰𝘸.
𝙏𝙝𝙞𝙨 𝙖𝙧𝙩𝙞𝙘𝙡𝙚 𝙞𝙨 𝙛𝙤𝙧 𝙮𝙤𝙪 𝙞𝙛:
you have ever compared yourself to a published figure and felt behind.
𝙄𝙩 𝙞𝙨 𝙣𝙤𝙩 𝙛𝙤𝙧 𝙮𝙤𝙪 𝙞𝙛:
you already track your runway date, your paying customers, your retention and your real hourly rate. You have better data than this article does.
The four numbers above are the ones I built FounderWise to hold. A short assessment gives you a score with the weakest category named, and then it keeps the history, so the next time you look you are comparing yourself to yourself in June rather than to a median somebody computed over survivors. Free to start, no card, one email link: app.founderwise.io
Advice is free. A year spent measuring against the wrong benchmark is not.
Josh
A product for founders who track Klyk revenue updates.
ProblemRevenue updates are hard to track in one place.
DanielK
@danielkbuilds
Day 1 of trying to get bevizio.com to $10k MRR.
Yesterday was day 0. I launched on Product Hunt, hit #1, and got 100 paying customers.
Oh wait, no. That was a dream.
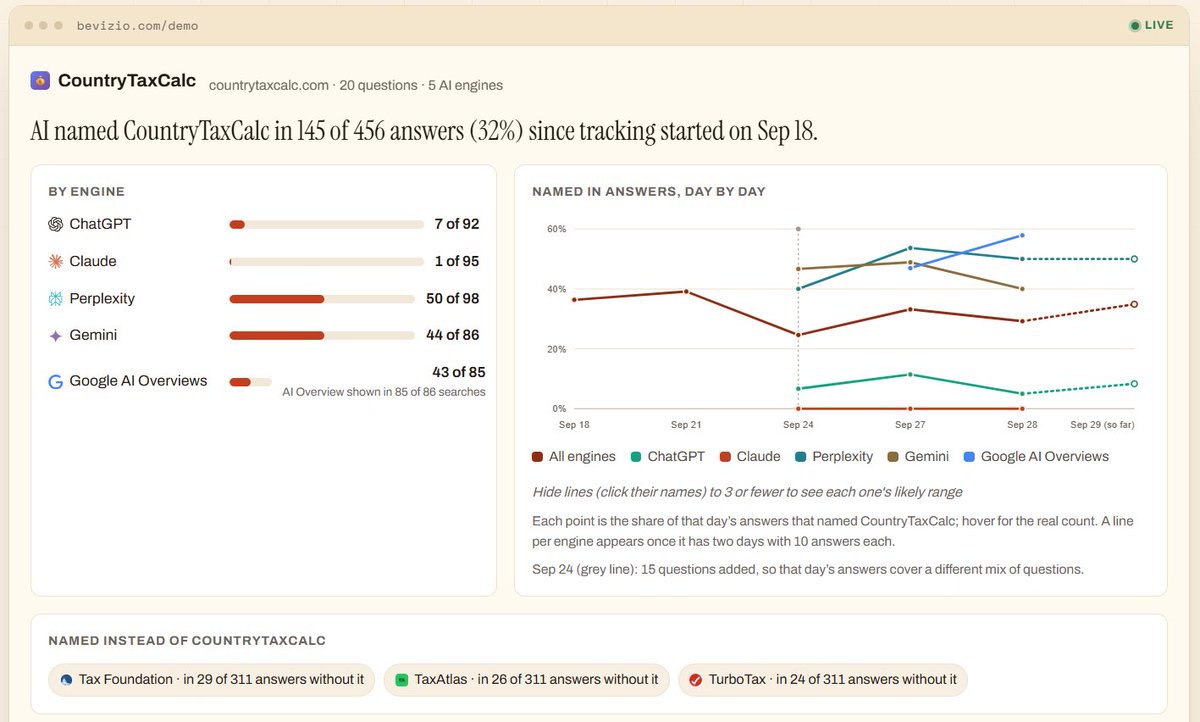
Actually starting today: blogs + SEO. Here's what Bevizio says AI is recommending for CountryTaxCalc (My tax calculator website) so far 👇
An AI recommendation tracker for people watching what models suggest about their website.
ProblemIt is hard to see what AI systems are recommending about your site.
Richelo Killian
@RicheloKillian
Day 59 of the restart sprint for isitdisposable.com. September ends today, so the month's honest ledger:
Shipped: the September data report (edition two, first churn measurements, 1,215 resurrected domains), seven blog pieces including four integration guides, a marketplace deal negotiated and structured on my terms, the platform core extracted so the next four products build on rails, an analytics migration, and the WordPress plugin's requested changes.
Firsts: first page one rankings on Google and Bing. First ever ChatGPT referral. First week every input floor went green.
Flops: two Hacker News submissions eaten by spam filters before human eyes. An enterprise outreach floor that went to zero once while comfort work volunteered.
Revenue: $0 then, $0 now. What changed is everything upstream of revenue: the doors, the data, the rankings, the pipeline, the cohort waiting behind one marketplace approval.
October has three weeks of sprint left and three loaded events: the report edition with our first ever domain lifespan data, its Hacker News submission, and Day 90's full accounting. Whatever the last line says, it will be true. That has been the product of this account all along.
$0 MRR. 20 days left. One month to land it.
#buildinpublic
MRR
$0
How they grewGoogle and Bing rankings, ChatGPT referral, Hacker News submissions